

Regional banking company Webster Financial (NYSE:WBS) announced better-than-expected revenue in Q3 CY2025, with sales up 13.1% year on year to $732.6 million. Its GAAP profit of $1.54 per share was 0.8% above analysts’ consensus estimates.
Is now the time to buy Webster Financial? Find out by accessing our full research report, it’s free for active Edge members.
Webster Financial (WBS) Q3 CY2025 Highlights:
- Net Interest Income: $631.7 million vs analyst estimates of $631.5 million (7.1% year-on-year growth, in line)
- Net Interest Margin: 3.4% vs analyst estimates of 3.4% (in line)
- Revenue: $732.6 million vs analyst estimates of $726.1 million (13.1% year-on-year growth, 0.9% beat)
- Efficiency Ratio: 45.8% vs analyst estimates of 47.7% (189.1 basis point beat)
- EPS (GAAP): $1.54 vs analyst estimates of $1.53 (0.8% beat)
- Tangible Book Value per Share: $36.42 vs analyst estimates of $36.15 (9.5% year-on-year growth, 0.8% beat)
- Market Capitalization: $8.99 billion
Company Overview
Founded during the Great Depression in 1935 and evolving into a major Northeastern financial institution, Webster Financial (NYSE:WBS) is a bank holding company that provides commercial banking, consumer banking, and employee benefits solutions through its Webster Bank and HSA Bank division.
Sales Growth
Two primary revenue streams drive bank earnings. While net interest income, which is earned by charging higher rates on loans than paid on deposits, forms the foundation, fee-based services across banking, credit, wealth management, and trading operations provide additional income. Over the last five years, Webster Financial grew its revenue at an incredible 19.2% compounded annual growth rate. Its growth beat the average banking company and shows its offerings resonate with customers, a helpful starting point for our analysis.
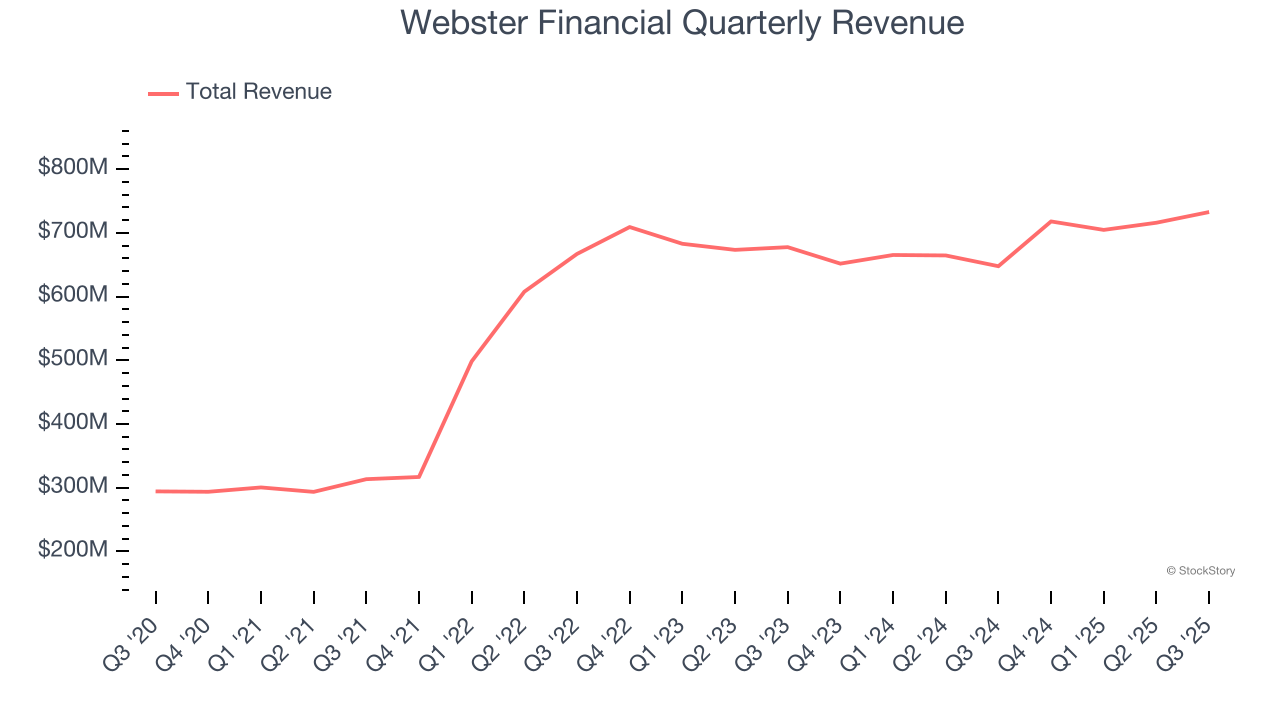
We at StockStory place the most emphasis on long-term growth, but within financials, a half-decade historical view may miss recent interest rate changes, market returns, and industry trends. Webster Financial’s recent performance shows its demand has slowed significantly as its annualized revenue growth of 2.3% over the last two years was well below its five-year trend. 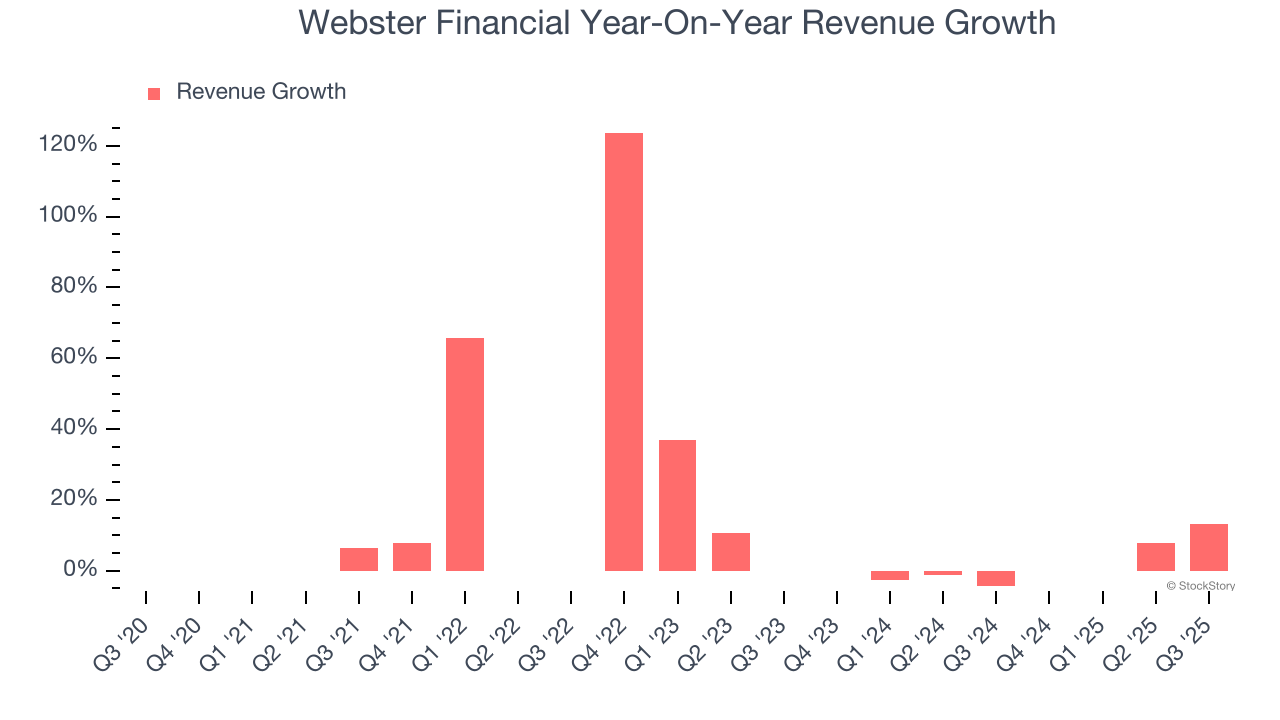 Note: Quarters not shown were determined to be outliers, impacted by outsized investment gains/losses that are not indicative of the recurring fundamentals of the business.
This quarter, Webster Financial reported year-on-year revenue growth of 13.1%, and its $732.6 million of revenue exceeded Wall Street’s estimates by 0.9%.
Net interest income made up 82.5% of the company’s total revenue during the last five years, meaning Webster Financial barely relies on non-interest income to drive its overall growth.
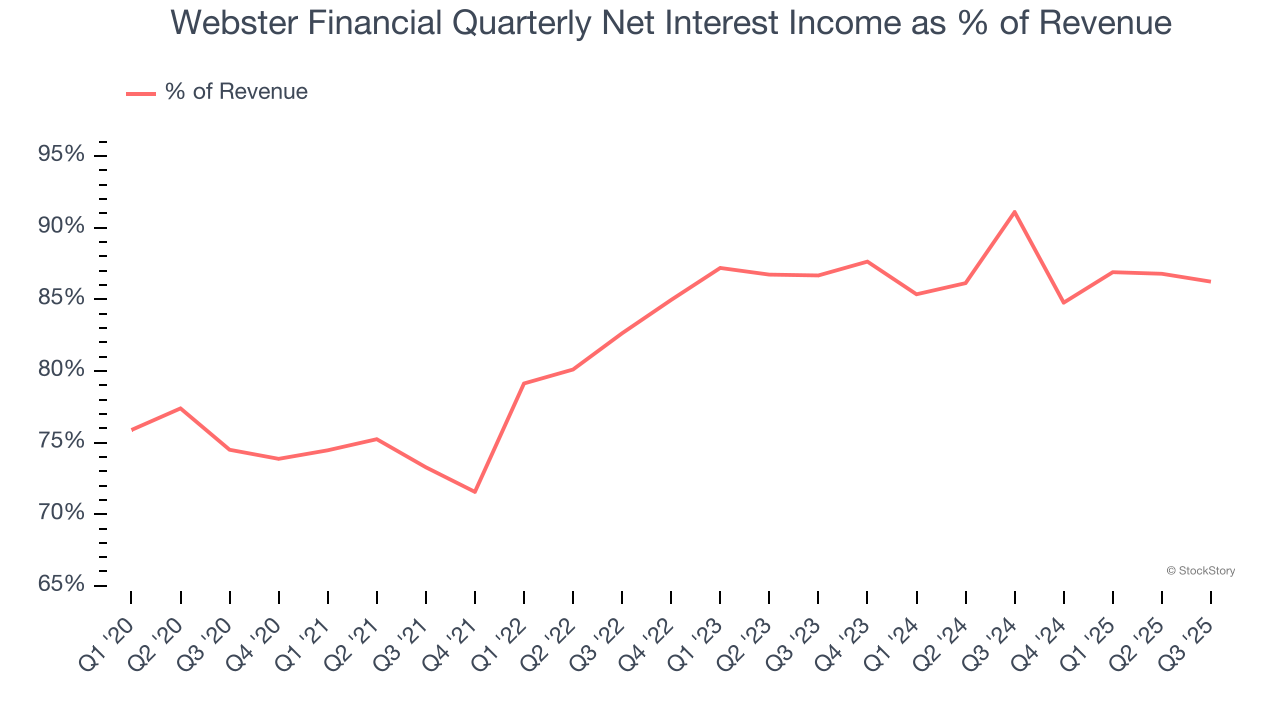
Markets consistently prioritize net interest income growth over fee-based revenue, recognizing its superior quality and recurring nature compared to the more unpredictable non-interest income streams.
Software is eating the world and there is virtually no industry left that has been untouched by it. That drives increasing demand for tools helping software developers do their jobs, whether it be monitoring critical cloud infrastructure, integrating audio and video functionality, or ensuring smooth content streaming. Click here to access a free report on our 3 favorite stocks to play this generational megatrend.
Tangible Book Value Per Share (TBVPS)
Banks profit by intermediating between depositors and borrowers, making them fundamentally balance sheet-driven enterprises. Market participants emphasize balance sheet quality and sustained book value growth when evaluating these institutions.
Because of this, tangible book value per share (TBVPS) emerges as the critical performance benchmark. By excluding intangible assets with uncertain liquidation values, this metric captures real, liquid net worth per share. On the other hand, EPS is often distorted by mergers and flexible loan loss accounting. TBVPS provides clearer performance insights.
Webster Financial’s TBVPS grew at a decent 5.5% annual clip over the last five years. TBVPS growth has accelerated recently, growing by 11.2% annually over the last two years from $29.48 to $36.42 per share.
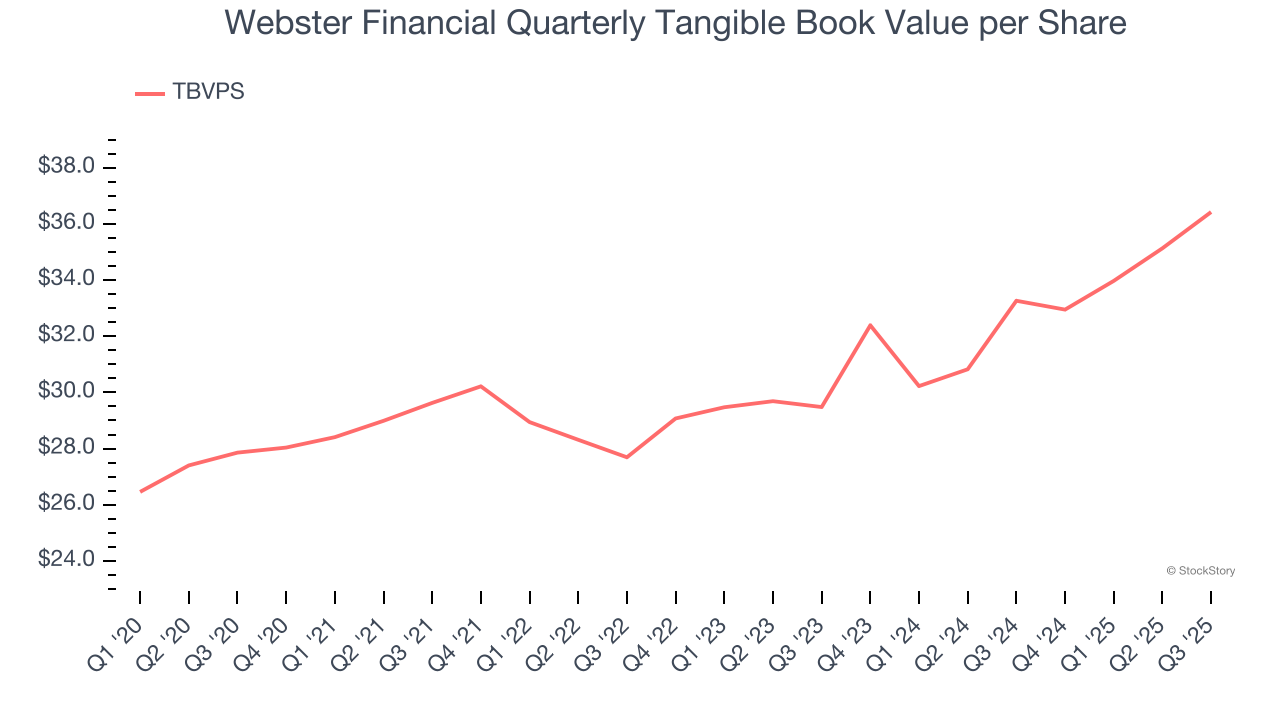
Over the next 12 months, Consensus estimates call for Webster Financial’s TBVPS to grow by 11.5% to $40.61, top-notch growth rate.
Key Takeaways from Webster Financial’s Q3 Results
It was good to see Webster Financial narrowly top analysts’ revenue expectations this quarter. We were also happy its EPS and tangible book value per share narrowly outperformed Wall Street’s estimates. Overall, this quarter was solid. The stock traded up 1.7% to $54.98 immediately after reporting.
Is Webster Financial an attractive investment opportunity right now? We think that the latest quarter is only one piece of the longer-term business quality puzzle. Quality, when combined with valuation, can help determine if the stock is a buy. We cover that in our actionable full research report which you can read here, it’s free for active Edge members.